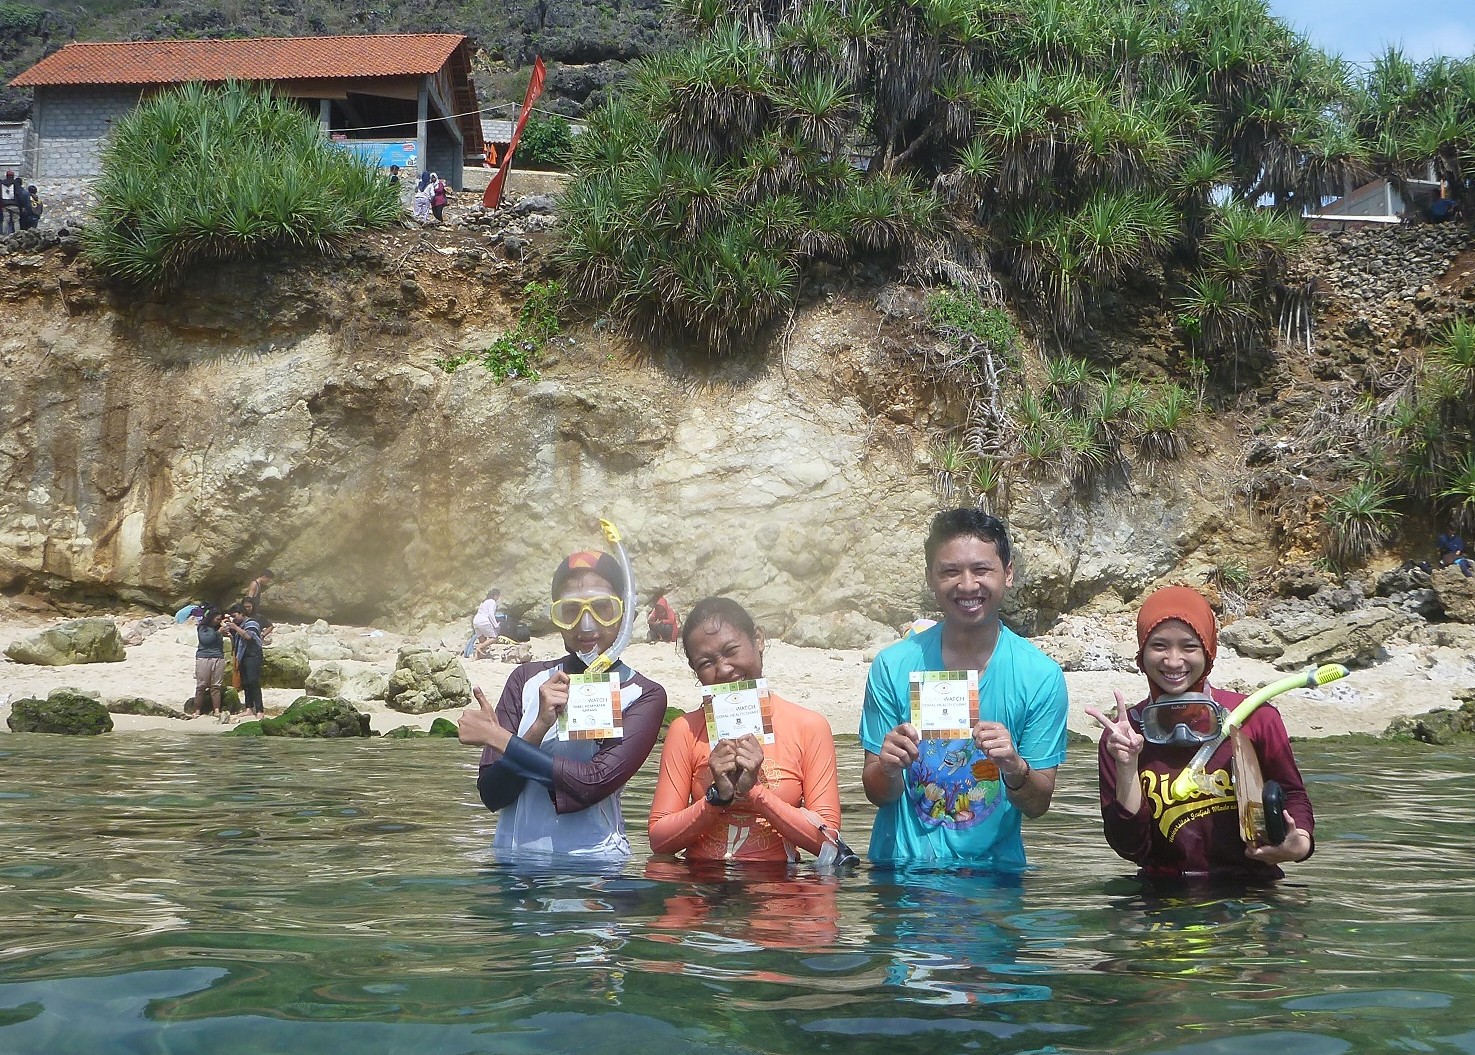
Yesterday, got new experience with my friends (Ryannika, Ida, Zaki and Rindra) to try another new cool stuff, coral health chart from CoralWatch (citizen science project based at The University of Queensland, in Brisbane, Australia) yeay!
 This Chart is basically a series of sample colours, with variation in brightness representing different stages of bleaching/recovery, based on controlled experiments. It is an inexpensive, simple, non-invasive method for the monitoring of coral bleaching and assessment of coral health. In the field, users simply compare colours of corals with colours on the chart and record matching codes. With the help of the Health Charts, anyone in the world can monitor the health of any reef across the globe. All of instruction materials can easily find on their website include how to use coral chart, simple method to understand by non-scientist people as this project rely more on citizen science.


Why colors matters?
During the early months of 1998, 2002, 2004 & 2006, many corals on the Great Barrier Reef, Australia and many other reefs in the world changed their colouration from brown to a brilliant white, purple or green. Actually it was a global phenomena especially in tropical water. This ‘whitening’ of the coral is called coral bleaching and is due to a loss of the symbiotic dinoflagellates (algae) living within the tissue of the coral. In a healthy reef, the algae supply the coral with energy (sugars and amino acids) and in turn receive products essential to their survival (ammonia and phosphate).

The single greatest determining factor as to whether a coral survives a bleaching event is the amount of time that it is exposed to elevated temperatures under high light conditions. The longer the coral is exposed, the greater the chances of mortality, with many succumbing to disease and being overgrown by algae. Moreover, pollution from urban or agricultural run-off and sedimentation will exacerbate it.
When a coral bleaches, it is not dead, corals can recover quite quickly from bleaching events once the stresses are relieved, in some cases regaining their colour in a matter of days. However, each bleaching event weakens the overall health of the coral over time. Finally, using this chart can make us (scientists or non-scientist) to observe bleaching event around us and always give our best shot to SAVE CORAL (please click)
Several tips to use this chart (my own tips – not official :D)
1. Download and read all of instruction (coralwatch.org)
2. Order free coral chart HERE
3. Familiarize with coral “simplified” growth form such as boulder, plate, and branching
4. Do it with your friend, so you can discuss when try to match color of coral colony and chart
5. Take some groupie photos with your lovely pals 😀

for further reading about coral bleaching HERE


